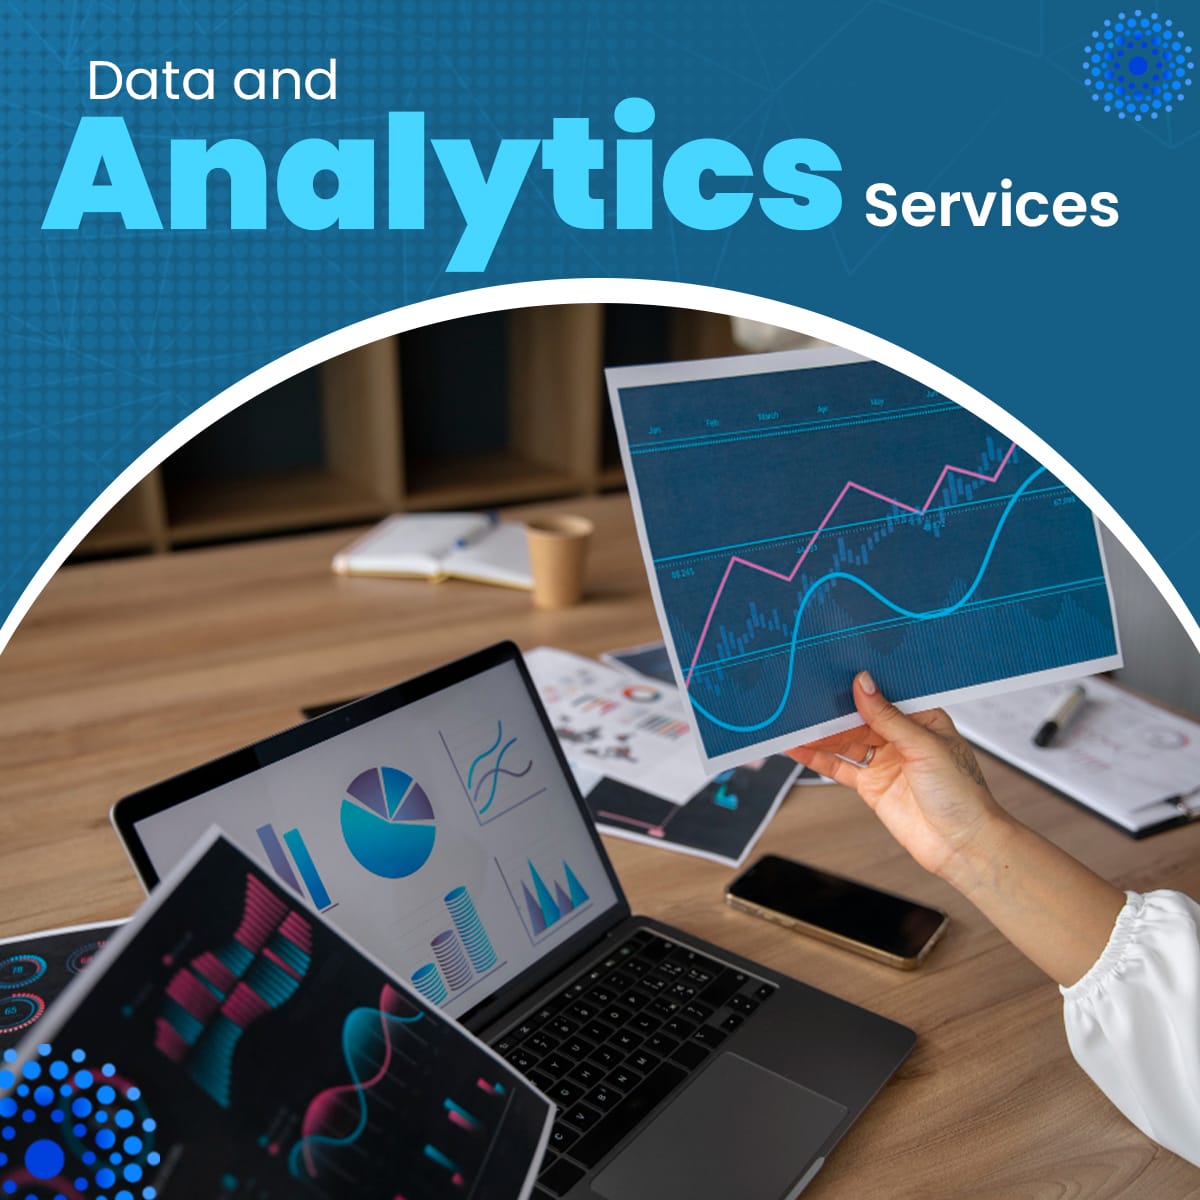
Data Visualization Services
Discover Valuable Data Through Language of Decision Making. Unveil Insightful Data Visualization Capabilities.
Data Visualization Services
Discover Valuable Data Through Language of Decision Making. Unveil Insightful Data Visualization Capabilities.
Our custom data visualization competencies empower businesses to unlock the knowledge hidden in data and discover data-driven insights and patterns. We have a skilled team of data experts who choose an agile and extensible data platform that suits your business needs and enables data visualization to facilitate decision making, spot trends, track business goals, compare performances.
Right from strategy to implementation of tailored solutions, we bring to you high volumes of complex data in a simple and intuitive manner through pixel-perfect reports and interactive dashboards. Self-service reporting features are embedded in the solutions to lessen dependency on IT teams.
- Monitor and Track Key Performance Indicators (KPIs) to Enhance Corporate Workflows
- Spotlight Market Patterns and Trends for Business Optimization
- Recognize Potential Financial Risk Zones and Market Fluctuations
- Improve Marketing Campaigns through Client Behavior Monitoring

Development of Reports and Dashboards
Transform numbers into actionable insights, identify patterns and trends, and seamlessly interact with data through our interactive reports and visually engaging dashboards. Our creative visualization specialists craft and develop a customized approach for personalized dashboards, templates, and storyboards tailored to specific needs. We prioritize user-friendly and impactful data interaction through our diverse array of dashboards and reports.
- Strategic, Tactical, Analytical, and Operational Dashboards
- Line, Bar, Pie, Funnel, and Connectivity Charts, along with Symbol and Heat Maps, and Pivot Tables
- Monitoring KPIs and Identifying Constraints
- Comprehensive Reporting Development for All Enterprise Segments
- Advanced Data Interpretation and Conversion into Rich Visuals
Data Visualization & Business Intelligence (BI)
With demonstrated expertise and extensive experience, we integrate data visualization and business intelligence capabilities to deliver a comprehensive, enriched data experience. Our BI specialists develop robust BI solutions with advanced data analytics and visualization functionalities. We assess and optimize existing systems, re-architecting or re-platforming as necessary, to provide visually compelling reports and dashboards. Our emphasis on self-service BI empowers non-technical users to harness the full potential of data
- Establishing a Corporate Security Framework with Data Governance
- ETL/ELT Processes for Data Aggregation and Visualization
- Unified Data Repository for All Components
- Integration of Data from Disparate Sources
- Smooth Integration with Third-Party Systems
Optimization of Data Visualization
Refine and sustain your data visualization solutions for peak performance and ongoing optimization. We provide cutting-edge features, continuous support, and best practices to produce top-tier visualizations that eliminate extraneous visual elements and prevent misconceptions. Our adept designers deliver an optimized visualization setup showcasing real-time insights across your preferred devices, fostering collaboration and reducing load times
- Enhancement across various architectural tiers
- Innovative functionalities like deep dive and intuitive rearrangement
- Authorization mechanisms and network structures
- Balance between actionable tasks and efficiency
- Enhanced data models, pipelines, and semantic tiers
Upgrade/Transition of Business Intelligence Platform
We boast a proficient team of BI developers and administrators adept at installing, upgrading, and managing the entire business intelligence platform within an enterprise framework. We tailor system upgrade and migration plans accordingly. Our teams conduct thorough assessments, meticulously plan, and execute strategies to explore various options for upgrades or migrations. Whether it’s advancing to the next version or transitioning between platforms, we cater to your essential requirements
- Data scrubbing, validation, profiling, and quality assurance
- Boosted performance, additional features
- Transfer of data among components
- Modernizing application visualization
- Enhanced security and compatibility
FAQ's
How do your data visualization solutions enhance business capabilities?
Our Data Visualization Services empower businesses by revealing valuable insights concealed within data. Our proficient team of data professionals utilizes flexible and adaptable data platforms to facilitate visualization, fostering decision-making, trend identification, goal monitoring, and performance assessment.
How do you guarantee a user-friendly experience for interacting with reports and dashboards?
We craft interactive reports and visually captivating dashboards that extract insights from data. Our specialists devise customized strategies for personalized dashboards, templates, and storyboards. With our varied array of dashboards and reports, we facilitate user-friendly data interaction, allowing for effortless exploration of insights.
What are the primary areas of emphasis for your data visualization and business intelligence (BI) offerings?
Our Data Visual Representation & Business Intelligence (BI) services prioritize delivering enhanced data experiences. We develop resilient BI solutions incorporating advanced data analytics and visualization functionalities. Our methodology entails re-architecting or re-platforming current systems to deliver visually engaging reports and dashboards, with a keen emphasis on self-service BI for non-technical users.
What optimization levels are available for data visualization?
Our Data Visualization Optimization encompasses optimization across various architectural tiers. We guarantee state-of-the-art functionalities such as drill-down and drag-and-drop features. Furthermore, we implement access controls and network configurations to strike a balance between actionable insights and performance, all while ensuring system stability.
What advantages come with upgrading or migrating BI platforms?
Upgrading or migrating BI platforms yields numerous benefits. This includes data cleansing, validation, profiling, and quality assurance. The outcomes typically involve enhanced performance, additional functionalities, streamlined data transfer between components, modernized application visualization, enhanced security measures, and compatibility with the latest technologies.